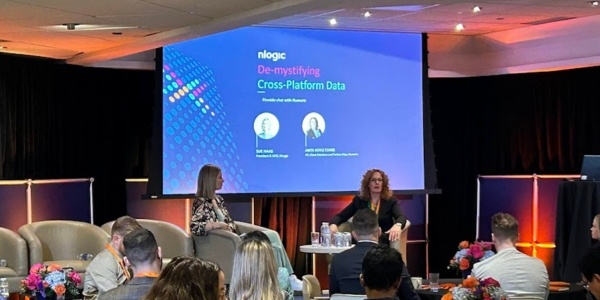
President & COO of NLogic, Sue Haas, sat down with Anita Boyle-Evans, VP Client Solutions & Partnerships at Numeris, to discuss VAM, Numeris’ Video Audience Measurement dataset; how it will evolve and some common misconceptions.
What is VAM data?
VAM (Video Audience Measurement) is our first iteration of Cross-Platform Video Measurement and provides the ability to compare digital video and linear TV behaviours or even to compare digital to digital, all in one dataset. A first in Canada! It provides a complete picture of video consumption for our clients – all on a level playing field in terms of metrics and standards, all in one dataset.
Why did you develop VAM?
Video Audience Measurement is the first iteration of Numeris’ cross-platform video dataset. And we say first iteration because it currently covers Ontario and French Quebec, so around 60% of the Canadian population. And, as a lot of you already know, Numeris is actively deploying that solution to the rest of Canada. In a nutshell, VAM permits a unified understanding of multiplatform consumption and unduplicated reach – 2 very important needs in the industry today.
We continuously work with clients and gather feedback to continue to evolve VAM data, and are simultaneously deploying out our single-source National panel in preparation for the National product.

How does VAM help clients solve some of their problems?
VAM and Cross-Platform Video data brings clarity to video and helps clients to understand the relationships between linear and digital. We had two very clear directives when we started the journey to build a Cross Platform Video dataset.
1. I need to be able to have a complete picture of today’s video landscape.
For the first time, you can see digital and linear video in one database, all based on the same stringent methodology, standards and metrics, to compare and analyze. Not only does it help you compare broadcast vs streaming, but it also allows for analysis between digital platforms. VAM helps in the planning, buying, selling, programming, revenue management, and partnership opportunities areas to name a few. We know people are not watching less video than in the past, but they are consuming differently, and VAM allows us to see how, by providing the big picture.
2. I need to be able to analyze duplicated and exclusive reach.
By far, the other most asked question was “Help me understand the duplication in my audiences across all video”. VAM provides the answer. If I have a campaign with a focus on frequency, maybe I want a lot of duplication in my audiences. But, if I want higher reach, VAM can help determine the best approach by identifying the exclusive reach and duplicative reach. VAM allows the analysis to compare this against different age breaks, different time blocks, different seasons, etc. not just overall comparison. With the ability to look at unduplicated and duplicated reach between linear and digital or just digital to digital, it will level the playing field between all video.

Does VAM include cord-cutters?
The panel is NOT exclusive to cable subscribers… we control the panel against the Universe Estimates to ensure we include anyone who can access Video, no matter how they consume it. We confirm with potential panelists they have access to video including how they access it - which for some will be via the internet only. That number varies by market which is something we are aware of and recruit against, so our panel has true representation that includes those cord-cutters and cord-nevers.”
Does VAM report out-of-home viewing?
To report data, we must be able to measure it. For us to measure it, we must be able to capture it.
In linear data, the broadcasters encode their content so we can easily identify it, and with our technology, we can distinguish between in-home and out-of-home, which has been reported in our linear data for years.
Broadcasters tag their digital content. As such, we capture what people are consuming in-home via our passive meter set up in the home, and with our technology set up to access Comscore's census level data, we can also report out-of-home consumption for BVOD at a program level.
Digital platform consumption is also collected at the device level via our passive meter, so in-home consumption is available for all digital platforms. This is something clients are excited about as it has not been available up to now.
Why do you use people-based panels?
Great question and in a nutshell, here is what it comes down to – Quality. DATA MUST HAVE A SOLID foundation.
We know Hybrid measurement is the future as it allows more scale which provides granularity, stability, and accuracy to address the highly fragmented media market we live in. From these large datasets, we can pull a lot of information to create insights which in turn can tell us some very interesting stories. This provides us with a depth of knowledge – including a better understanding of behaviours, trends, and comparability and we can use these insights to help infuse actionable solutions for many of our business questions.
But at the foundation of any hybrid measurement design, you need people data. And what better than a panel to provide this type of data? You must be able to tie large datasets back to actual people!


