How to debug issues, directly in production, with Snapshot Debugger

Contents
As we continue to strive to be more agile and responsive in terms of managing potential issues in our applications, the importance of being able to investigate and debug issues directly in production became more evident. As an Azure hosted platform with Visual Studio collaboration, we decided to explore Snapshot Debugger.
Why Snapshot debugging?
Snapshot Debugger is a tool that allows .NET developers to get better visibility into their remote applications.
With Snapshot Debugger:
- Developers can view key information related to exceptions that an application is throwing, which quickens the time to triage and eventually solve the problem.
- Developers can drill down into an application’s code at the exact moment that the exception occurred to help pinpoint causes of the issue without having to negatively impact the performance of the application while it’s in production.
- The production debugging experience feels very much like the local debugging experience.
- Supporting production apps is a lot easier.
- It is possible to debug highly distributed apps running on multiple servers.
- Ensure secure access to production data: snapshots are encrypted both in transit and at rest, and viewing snapshots is protected by RBAC (role based access control) and audited. The subscription owner must explicitly allow access for users to view snapshots by granting the "Application Insights Snapshot Debugger" role to users.
How are we using it?
Snapshot Debugger is accessible through two locations:
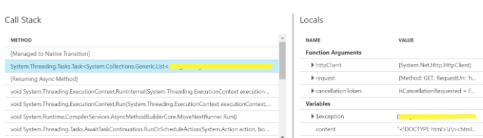
- The Azure Portal, where you can see local variables in your call stack (like the example shown below). In Visual Studio Enterprise, you can access this feature by downloading a snapshot from the Azure Portal (the extension is .diagsession) and opening it with Visual Studio.
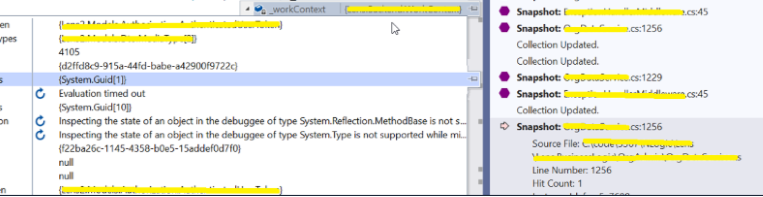
- You can also attach Visual Studio Debugger to applications running in Azure in live snapshot debugging mode. It lets you capture snapshots at specified lines of code by using Snapshot, as shown in third screenshot below.
What challenges did we face?
Although the documentation seems pretty straight forward, there were a few challenges that we faced when trying to make Snapshot Debugger work:
- Since our app is a self-contained .NET Core application, enabling only the snapshot debugging site extension through the Azure portal did not capture any snapshots. We also had to add the Nuget package and code in Startup file as mentioned here.
- Our code contains an exception middleware class to handle exceptions. This middleware blocked the snapshot debugging from taking snapshots. As a solution, we had to re-throw the exception from the middleware catch block. The code to re-throw is a simple one line of code which is

After overcoming the above challenges, we faced one more issue worth noting, where one of the exceptions did not show the snapshot icon in Azure portal ever. The snapshot collector was getting an error when it was trying to de-optimize the code, which was preventing it from taking the snapshot. This ultimately required a fix to be added in the new version of the Nuget package released by the Microsoft team which handled InvalidOperationException when de-optimizing dynamic methods (e.g. Entity Framework).
Snapshot debugging in Visual Studio also did not work straightaway even after we did the steps mentioned in the documentation. Snapshot Debugger tool, for desktop applications, analyzes and attaches to only the w3wp.exe and does not support multiple processes. Since our process was a child process to the w3wp.exe, we had to add a private extension to our Azure site to allow Snapshot Debugger to attach to our child process. This private extension was provided to us by a Microsoft team member over email with a note that this will work as long as our processes are stable. They also confirmed that they are working on adding this feature in the future.
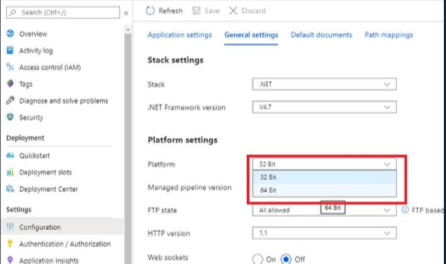
One last fix that we had to do was to change the platform setting of our Azure site to 64 bit so that the debugger architecture for our site matched that of the child process.
On the whole, we faced only a few hurdles to set up Snapshot Debugger and to make it work on our live site. The efforts to configure, test and coordinate with the Microsoft team were valuable and made our debugging experience with live apps much easier!
Happy Debugging!
Other blog posts you may enjoy:
How to collaborate with Visual Studio and Visual Studio Code’s Live Share
How to move from monolith apps to modular apps
5 ways to build application flexibility and efficiency