Contents
The release of ad tracking data for the TSN stations is great news for those advertisers who use these stations regularly. It helps to give a more complete picture of how their campaigns are performing.
With this in mind, we thought it would be a good idea to examine the impact this extra data would have on the analysis of a major sporting event such as the final playoffs for the Raptors last year. Previously we would have been able to analyze the CTV & Sportsnet stations (& RDS in Montreal). Now we can see the advertisers across all stations.
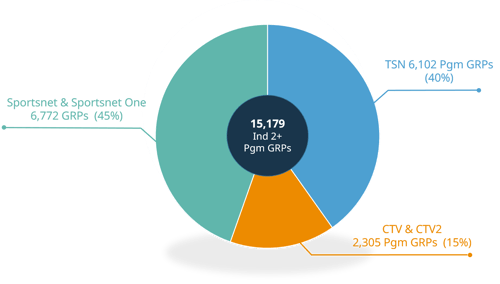
All figures Ind2+ Program GRPs, Toronto EM – 6 games May 30 – Jun 13, 2019.
When looking at the overall program GRPs across the games we can see that 40% were attributed to TSN stations. Adding these stations to the analysis increases the overall Program GRPs for the playoff finals by 67%.
Heaviest advertising categories during the NBA Playoff finals
The heaviest advertising categories on the different station groups differ slightly.
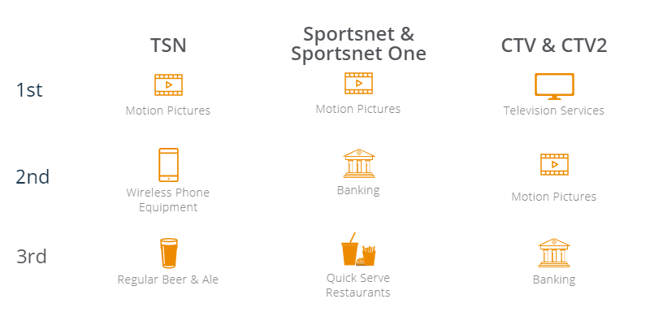
Fifteen different movies were advertising during the playoff finals making Motion Pictures the largest category of advertising with 8% of all program GRPS. Fast & Furious Presents Hobbs & Shaw had the heaviest weight of activity in this category.
Prior to this new TSN data release this campaign would have achieved 53% Ind2+ reach during the playoff finals. With the new TSN data this jumps to 60% reach, almost 4.8m Ind2+ with 623k of those only seeing the commercial on the TSN stations.